
Observability in microservices is not optional—it’s essential. In modern distributed systems and automated CI/CD environments, robust observability enables teams to detect failures proactively, reduce mean time to resolution (MTTR) and continuously improve reliability and performance.
Introduction
As systems shift from monoliths to finely-grained services, traditional monitoring alone becomes insufficient. Engineers, SREs and DevOps teams must adopt an observability-first mindset to answer three fundamental questions: What is happening?, Why is it happening? and How can we prevent it? This post explores the core pillars—metrics, logs and distributed tracing—and explains how observability integrates with CI/CD pipelines to deliver faster incident response, improved uptime and better customer experiences.
Why observability matters in distributed microservices?
Distributed microservices introduce complexity: network failures, partial outages, increased surface area for bugs, and emergent behavior due to inter-service dependencies. Observability provides the telemetry and context to understand runtime behavior and make informed decisions.
- Proactive detection: Observability enables detection of subtle degradation before customer impact through trend analysis and anomaly detection.
- Faster incident response: Rich telemetry reduces the time to identify root cause, lowering MTTR.
- Capacity and performance optimization: Metrics and traces reveal hotspots and inefficiencies for targeted optimization.
- Continuous verification: Observability woven into CI/CD validates changes in staging and production, enabling safe, fast deployments.
The three pillars of observability
Most modern observability strategies are built around three complementary pillars. Each provides different visibility and, together, they enable deep operational insight.
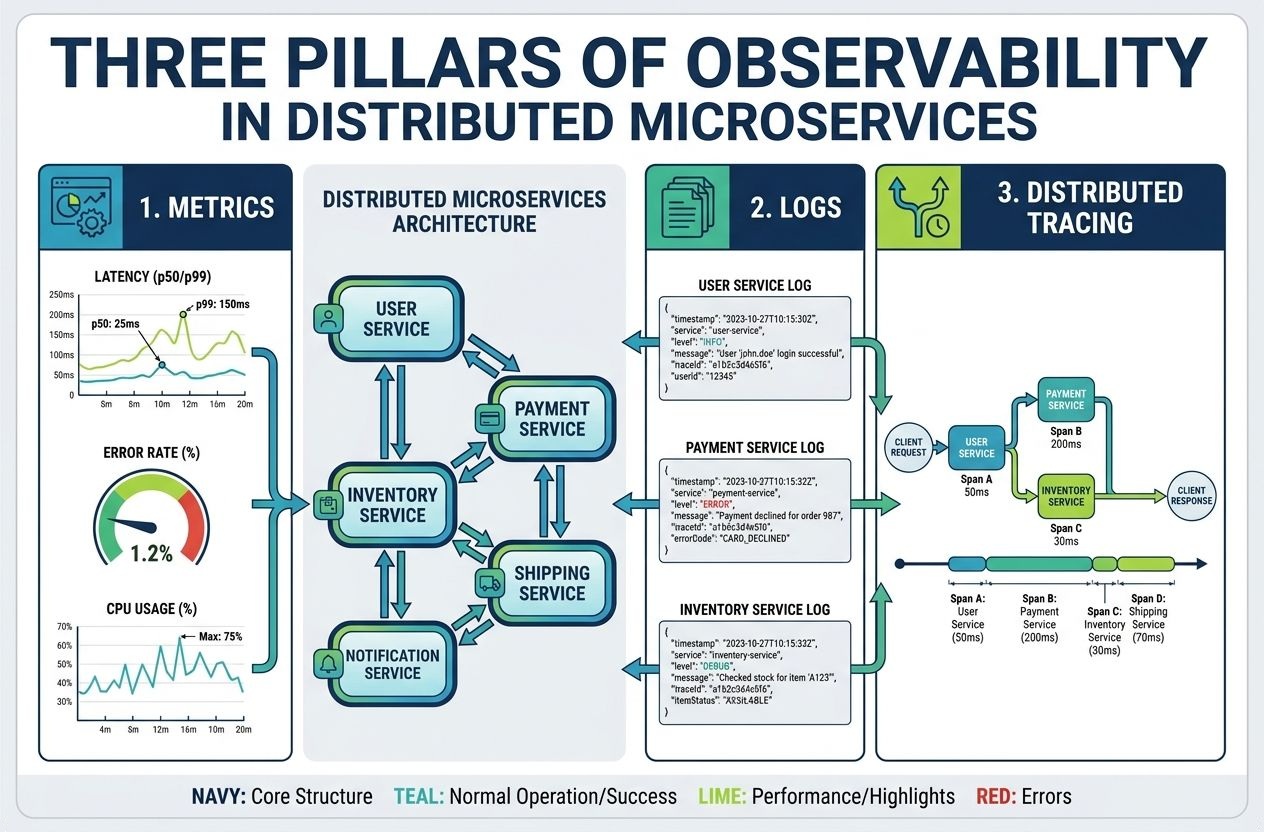
1. Metrics
Metrics are numeric measurements sampled over time—latency percentiles, request rates (RPS), error rates, CPU usage, memory consumption and custom business metrics. They are ideal for alerting, dashboards and capacity planning.
- Best practices: Use meaningful, cardinality-aware metrics; capture percentiles (p50, p90, p99) and avoid high-cardinality labels that explode storage and query costs.
- Tools: Prometheus for scraping and time-series storage, Grafana for visualization, and Cortex/Thanos for scalable long-term retention.
2. Logs
Logs provide context-rich, textual records of events—errors, warnings and structured application events. They are crucial for investigative workflows and forensic analysis.
- Best practices: Emit structured logs (JSON), include correlation IDs, and redact sensitive information. Ship logs to centralized systems for search and retention.
- Tools: Logstash, Fluentd/Fluent Bit, Elasticsearch (or alternatives like Loki), and cloud logging services.
3. Distributed tracing
Distributed tracing reveals end-to-end execution paths across service boundaries and helps pinpoint latency and error propagation. Traces show spans, timing, and context across the full request lifecycle.
- Best practices: Propagate a trace context (trace ID, span ID) through service calls, instrument critical synchronous and asynchronous boundaries, and capture span attributes for downstream analysis.
- Tools: OpenTelemetry for instrumentation, Jaeger and Zipkin for tracing backends, and commercial options like Honeycomb and Lightstep.
Observability vs. Monitoring: what’s the difference?
Monitoring typically focuses on known failure modes and pre-defined metrics and alerts. Observability is broader: it equips teams with arbitrary telemetry and contextual links between metrics, logs and traces to ask new questions and investigate unknown unknowns. In practice, both are necessary—monitoring provides coverage while observability enables deep exploration.
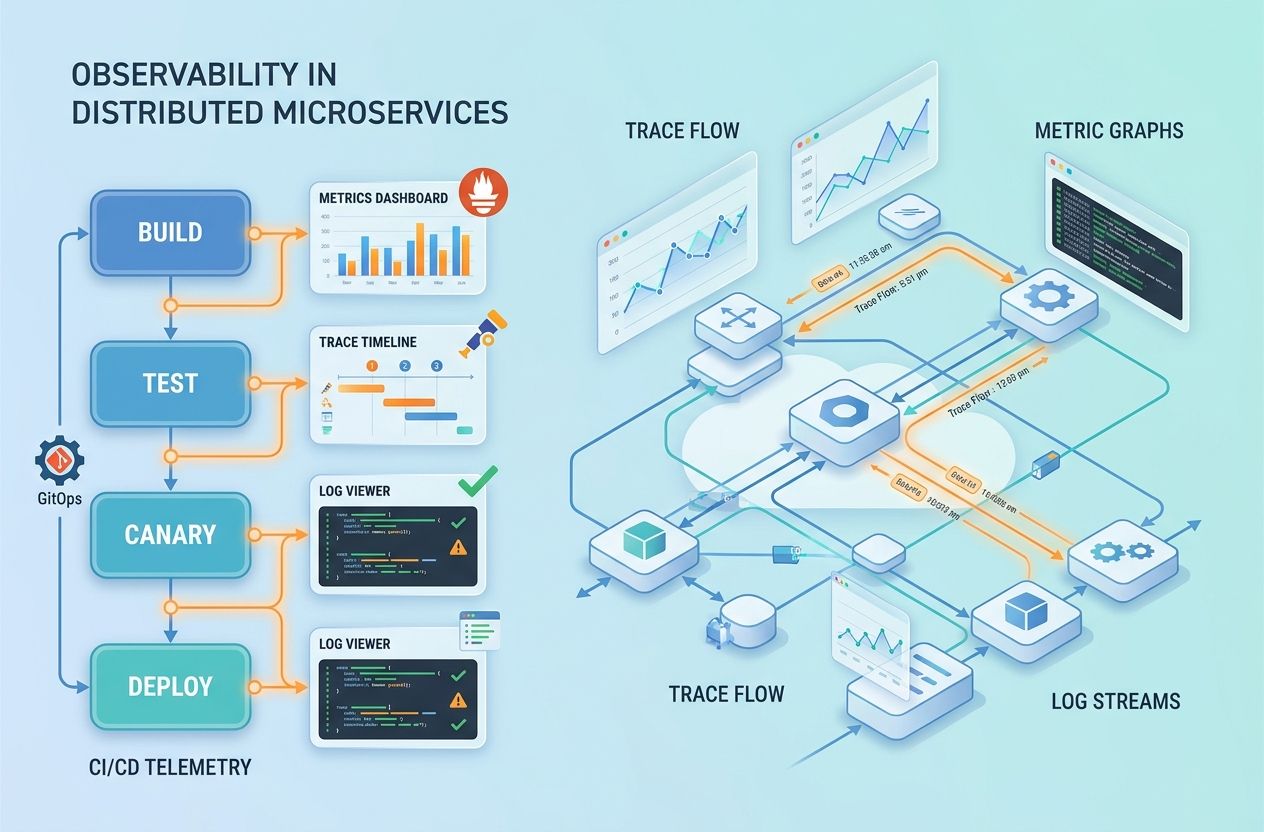
Integrating observability into CI/CD pipelines
Embedding observability into your CI/CD pipelines ensures that each code change is validated not only for functionality but for operational behavior. Observability-driven CI/CD reduces the risk of regressions and speeds up safe delivery.
Shift-left telemetry
Shift-left observability means capturing and analyzing telemetry earlier in the lifecycle—during unit tests, integration tests and canary deployments. Examples:
- Run synthetic load tests in CI and compare key metrics (latency, error rate) against baselines.
- Include smoke traces and structured logs in staging runs to detect integration regressions.
- Automate alerts or gates in pipelines based on SLO/SLA checks.
Canaries, feature flags and progressive delivery
When used with feature flags and canary releases, observability lets teams validate changes for small subsets before a full rollout. Track metrics and traces for the subset vs. baseline, and automate rollbacks when anomalies are detected.
Quality gates and SLOs
Define objective quality gates that pipeline jobs enforce, such as no increase in p99 latency beyond a threshold, no new error spikes, and adherence to SLOs. Integrate these checks with CI tools and deployment orchestrators so that problematic releases are blocked early.
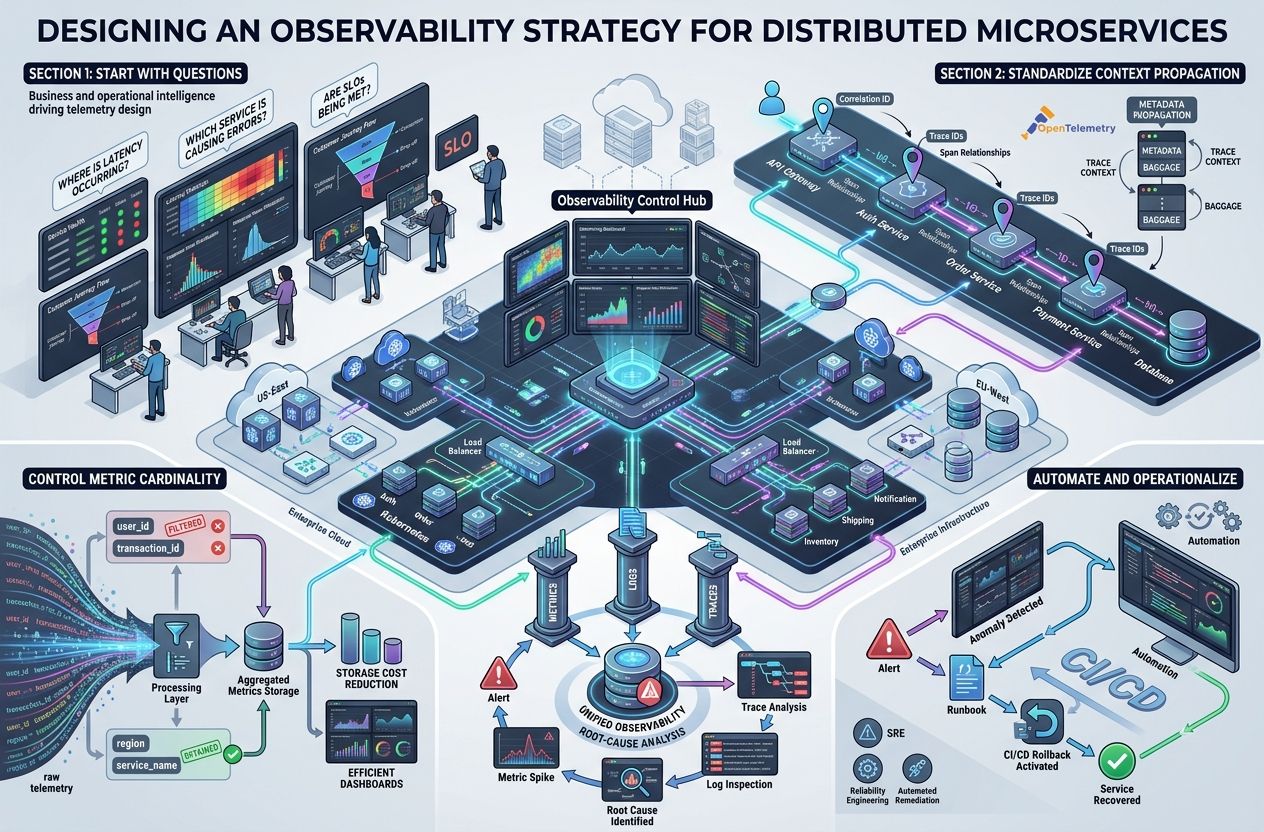
Designing an observability strategy for distributed microservices
Adopt a pragmatic, iterative approach. An effective strategy balances coverage, cost and actionability.
1. Start with questions
Design telemetry based on the operational questions you need to answer: Where is latency occurring? Which service is causing errors? Are customer-facing transactions meeting SLOs? Starting with questions ensures telemetry is actionable.
2. Standardize context propagation
Use a consistent correlation ID and distributed trace context across services. Open standards like OpenTelemetry simplify instrumentation and ensure consistent span/trace propagation.
3. Control metric cardinality
High-cardinality labels (user IDs, transaction IDs) can make metrics unusable and expensive. Limit cardinality at ingress and aggregate where appropriate. Keep logs for high-cardinality detail rather than metrics.
4. Centralize and connect telemetry
Centralized storage and tooling that links metrics, logs and traces is essential. Platforms that integrate these signals let teams jump from an alerting metric to the relevant traces and logs for fast root cause analysis.
5. Automate and operationalize
Automate alerting, anomaly detection and remediation playbooks. Use runbooks and SRE practices so that teams act consistently during incidents. Consider automated rollback triggers in CI/CD for defined failure patterns.
Observability use cases in microservices
Practical scenarios where observability delivers measurable value:
- Root cause analysis: Traces identify the exact service and span where latency spiked, while logs provide contextual error messages.
- Capacity planning: Metrics reveal growth patterns so teams can scale proactively.
- Performance optimization: Tracing uncovers tail latency sources and inefficient downstream calls.
- Security and compliance: Audit logs and telemetry help detect anomalous access patterns and support forensic investigations.
Observability metrics that matter
Key metrics for microservices observability include:
- Latency percentiles (p50, p90, p99).
- Request rate (RPS).
- Error rate and error budget consumption.
- CPU, memory and I/O utilization.
- Queue lengths and retry counts.
- Deployment success rate and change failure rate.
Tooling and open standards
Favor open standards to avoid vendor lock-in and simplify tracing across heterogeneous stacks. Key projects and tools include:
- OpenTelemetry — Instrumentation standard for traces, metrics and logs.
- Prometheus & Grafana — Time-series metrics and dashboards.
- Jaeger / Zipkin — Distributed tracing backends.
- Honeycomb, Lightstep, and Datadog — Observability platforms with advanced analysis.
- Kubernetes — Orchestration often paired with service meshes for observability metadata.
Operational best practices
Operationalizing observability requires culture, process and tooling:
- Define Service Level Objectives (SLOs): SLOs guide alerting thresholds and prioritize engineering work.
- Runbooks and playbooks: Document common incidents and remediation steps for consistent response.
- Blameless postmortems: Use telemetry to learn and improve rather than assign blame.
- Continuous instrumentation: Treat instrumentation as code and include tests to ensure telemetry is emitted correctly.
Challenges and how to overcome them
Common challenges include cost control, data volume, and instrumenting legacy systems. Strategies to address these:
- Sampling and aggregation: Use adaptive sampling for traces and aggregate metrics at appropriate resolutions.
- Retention policies: Tier telemetry storage: short-term hot storage for recent data and long-term cold storage for aggregated summaries.
- Incremental instrumentation: Start with critical paths and expand instrumentation iteratively.
Putting observability into action: a step-by-step plan
- Inventory your services and identify critical customer journeys.
- Define SLOs and key metrics for each journey.
- Instrument services using OpenTelemetry and centralize telemetry collection.
- Integrate telemetry-based quality gates into CI/CD pipelines.
- Create dashboards, alerts, and runbooks; run game days to validate readiness.
Conclusion
In distributed microservices environments and CI/CD-driven delivery models, observability in microservices is a strategic capability that reduces risk, speeds up recovery, and enables continuous improvement. By investing in the three pillars—metrics, logs and distributed tracing—standardizing context propagation and embedding observability into CI/CD, engineering teams can deliver reliable, performant systems at scale.
For further reading, see OpenTelemetry, the Prometheus project and the SRE book for foundational practices.